
Did you know there was a completely free way to get data on your blog, the traffic you are getting, and where it has come from, so that you can make good decisions about your site? No, neither did we a few years ago. Then we discovered Google Data Studio. Google not only lets you look at the stats on your site for free via Google Analytics. They also let you visualise that data easily so you can make better choices.
Google Data Studio allows you to access the information in Google Analytics. It can even be updated in real time if you set up the reports in the right way. We created this Google Data Studio tutorial for beginners and bloggers, check it out!
Note – it is much better to see and use Data Studio on a desktop, or a larger screen mobile. It isn’t a great site to work with on a mobile or an iPad.

It is surprisingly easy; so let’s talk you through it:
Let’s start by setting up Google Analytics
Set up a Google Analytics account, if you haven’t already done so. This is a little technical, so if you aren’t sure how to do it. Reach out to your hosting organisation to ask for their help. Always make sure that before you make any changes to your site, you have backed up your account too. If you aren’t self-hosted, and on WordPress.org; the Fairy Blogmother has a great article on adding Google Analytics to your account.
Are you using Google Analytics for the first time? Before using Google Data Studio, take time to get to know the system. Find out what it can do for your blog and what is can’t do. Also find out what data is important for you, and your blogging niche. We are a parent blog, and Twins Mommy has an excellent resource on Google Analytics for our sector. Have a play and fin an article that speaks to your sector. Absorb it, have fun, and play with it! This will make you more familiar with the system when you start using Data Studio with it.
Gentle note: Don’t rush into Data Studio as a blogger until you are comfortable with Google Analytics on the desktop. If you do; you may give up before you have even begun as to make Data Studio work for you. You need to know your way around Google Analytics.
Now, let’s set up Google Data Studio
As you have now set up Google Analytics, you need to set up your Google Data Studio account first. Then we can connect it to your website. To set up Google Data Studio, go to the Data Studio product overview homepage and choose the Use it for Free button
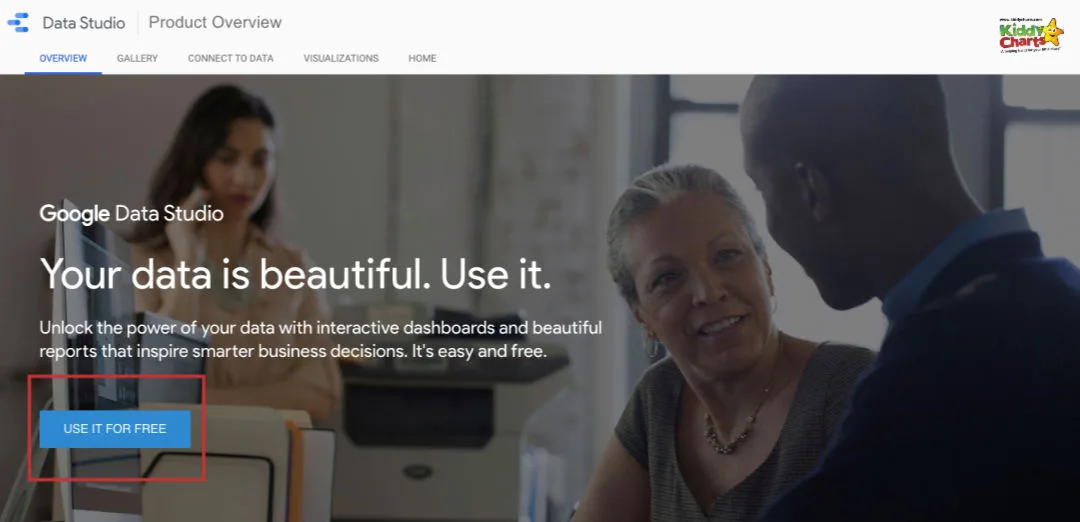
Log in to the Google account that you have set up, it MUST be the one that you have set up your Google analytics. If you accidentally set it up on an account that doesn’t have your Google Analytics account connected to it, you won’t be able to access information on your site.
You are now ready to go and create your first Data Studio report, and/or connect your first data source for your reports!


How to add Google Analytics to Data Studio as a data resource
In order to build our first report – we need to back up a bit! Do you want to use Data Studio to look at the traffic to your account? The first thing that you need to do is connect your Google Analytics account. This is connected as what is called a data resource.
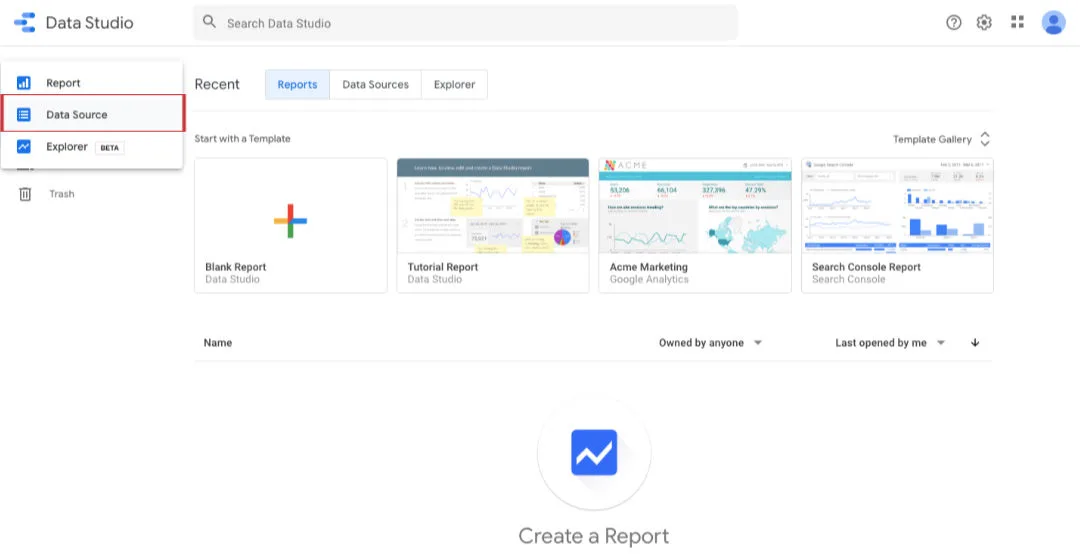
1) In the top left of the screen, is a drop down menu called “Create” select the plus by the side of the word:

2) You will then be presented with a drop down menu, select the Data Resource option.
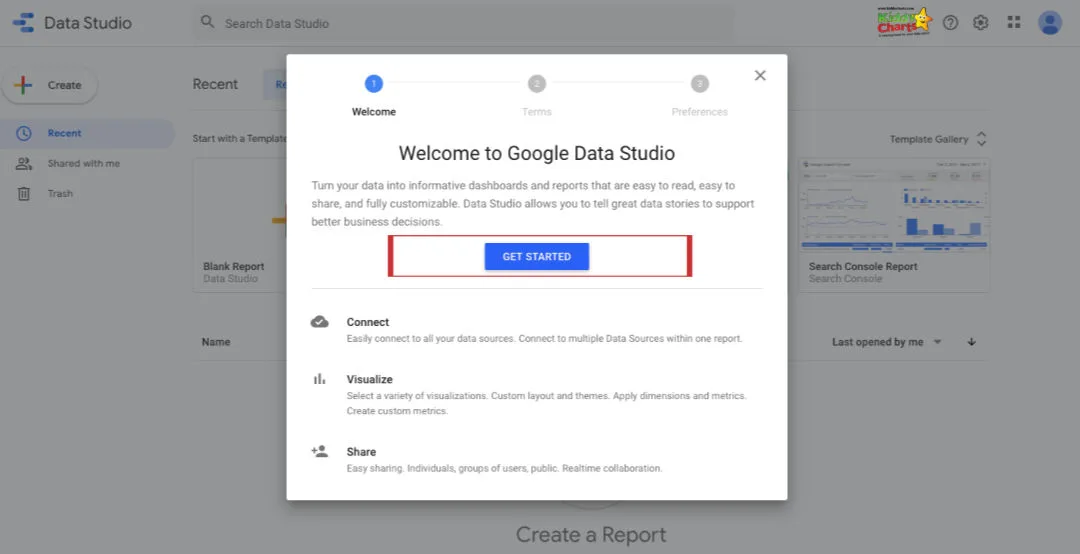
You will now be guided through a number of welcome screens for Google Data Studio, to insure that you set it up correctly, and that Google can communicate with you about the system as you want.
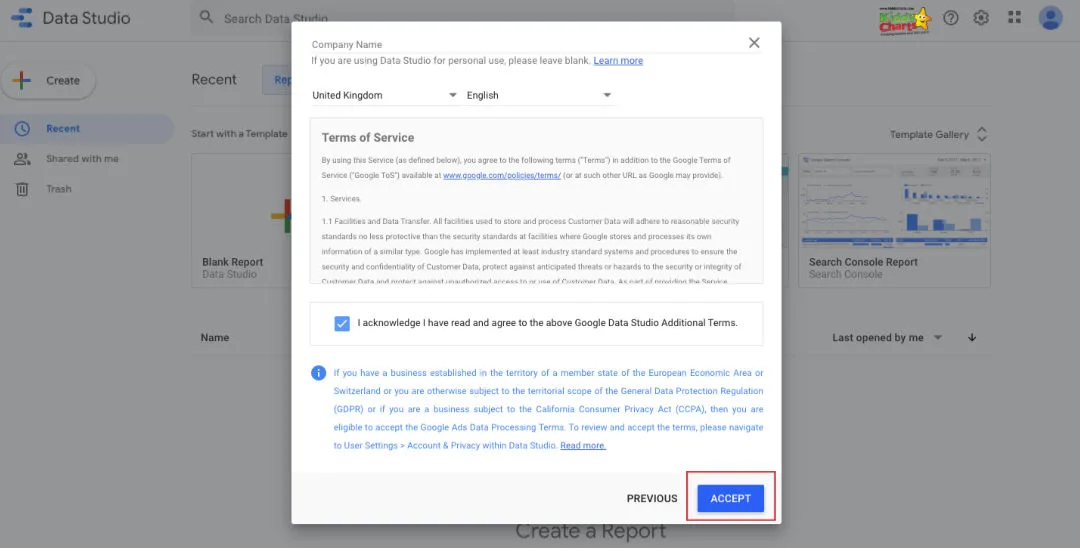
3) Choose Get Started and then screen down on the next screen to accept the terms and conditions.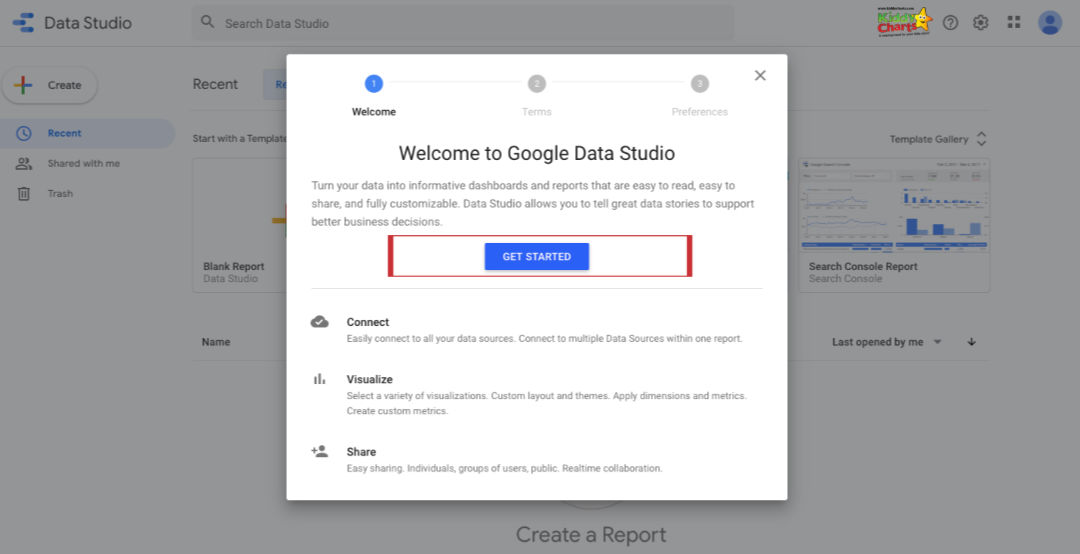
4) Choose your marketing preferences on the next screen – concerning the emails that Google and the system will send to you, and when you have changed to whatever you want, choose Done.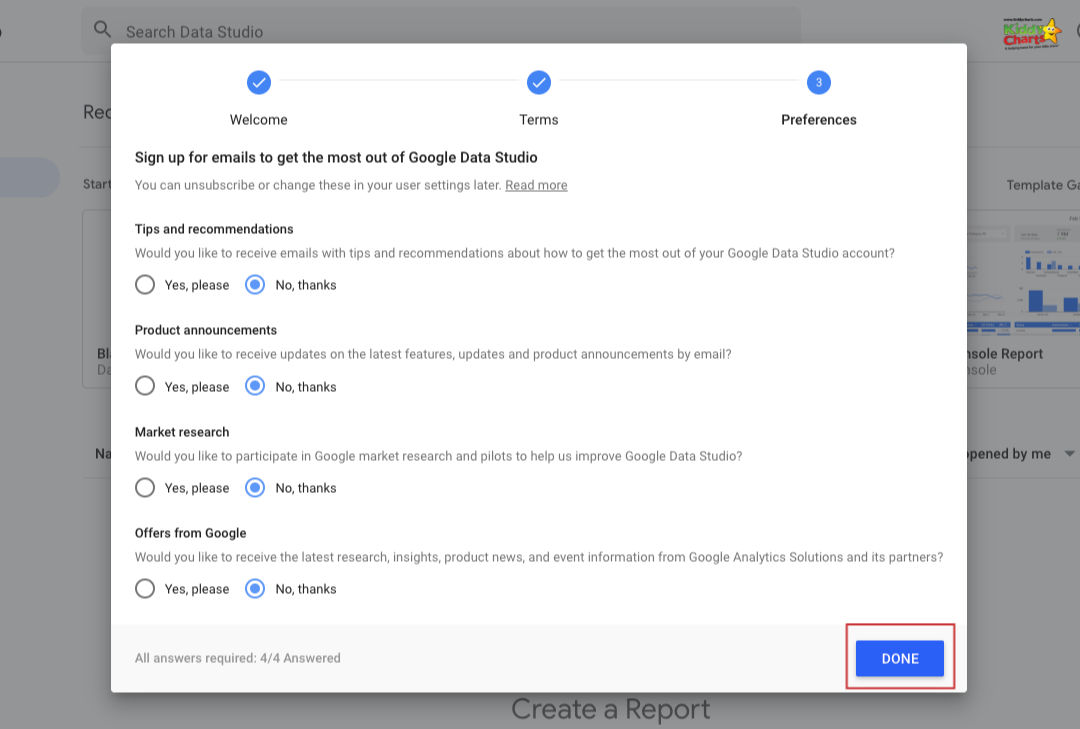

5) This will have reset what you were trying to do – so go back and choose Create Data Resource again, as before in step 2; this time you will be able to set up the resource properly.
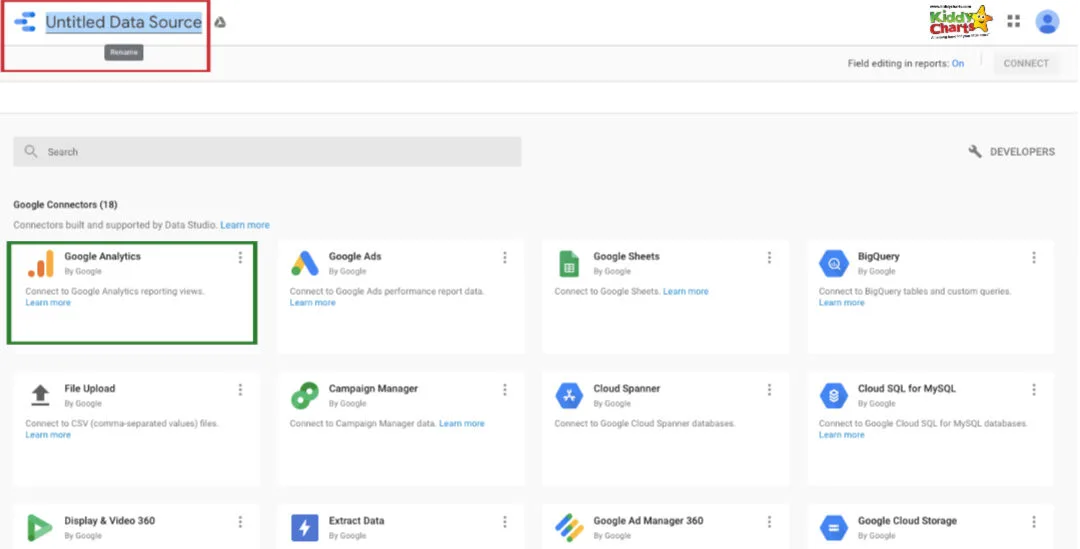
6) The first time you select this option, you are presented will all the data resources that you can possibly link to Data Studio. This can be a little overwhelming when you first see it, but actually, all you need is to select the Google Analytics source, which should be top left of the list.
You don’t really need to worry about the others, most of them are chargeable, but Google Analytics is totally free to use for you.
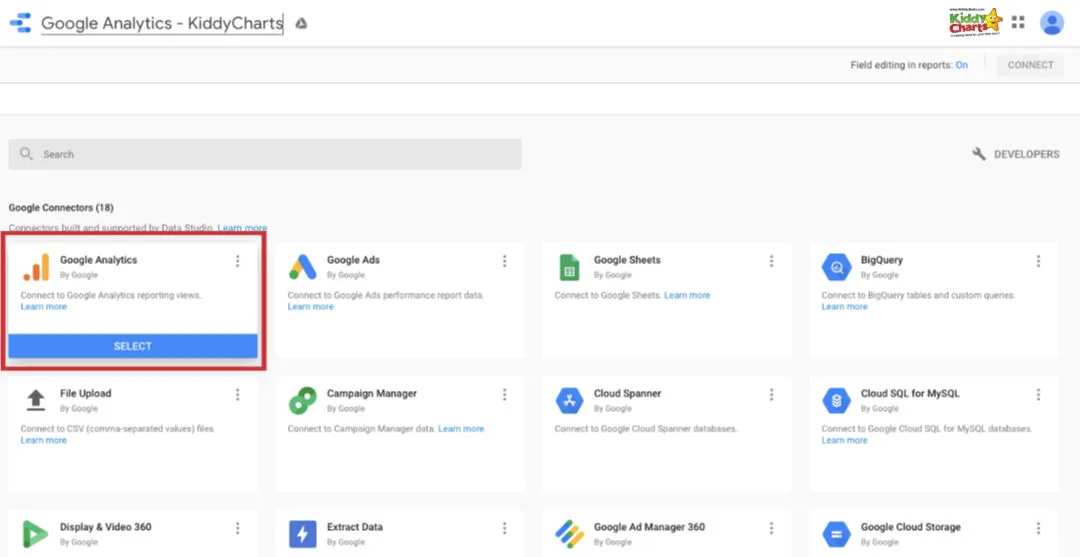
7) Change the name of the report to something that you will recognise as relevant to your site, and then select the Google Analytics option, and you can set up the connection. It will automatically create a new report for you once you finish connecting the data source with a table containing traffic sources for the last 28 days to whatever site is connected to your analytics.

8) Once you have selected this option – you will need to authorise the Google Analytics account that is associated with the email address you chose to set up Data Studio within. To do this – click on Authorise within the next screen

Still with me? Great! Let’s continue
The next part of this is a bit weird, but bear with me! You will be presented with a screen – suggesting that the app that you are using isn’t verified, and asking if you trust the developer. When you connect your Google Analytics, you are, in effect, setting up an app to talk (using Data Studio) to Google Analytics. So YOU are the developer, so obviously, you trust yourself.
9) So you need to click on Advanced on this screen so that you can proceed. This is a little disconcerting, but you are only granted access to your own email address, so there isn’t a security issue. You then need to click on Go to Google Data Studio (unsafe), and then grant the correct email and user id access to view your Google Analytics data.

You will be shown a screen explaining what you are about to do, and making sure it is OK.
10) Click Allow.
For those of you that are a little reticent – if you are part of a blogging network where you grant them access to your Google Analytics; this is what you are doing with Data Studio here. But YOU are creating the app that is accessing the info, and it isn’t managed by a third party, e.g. Blogfoster, Webfluential, etc. They all likely use Data Studio, or a variation to get access to your data.

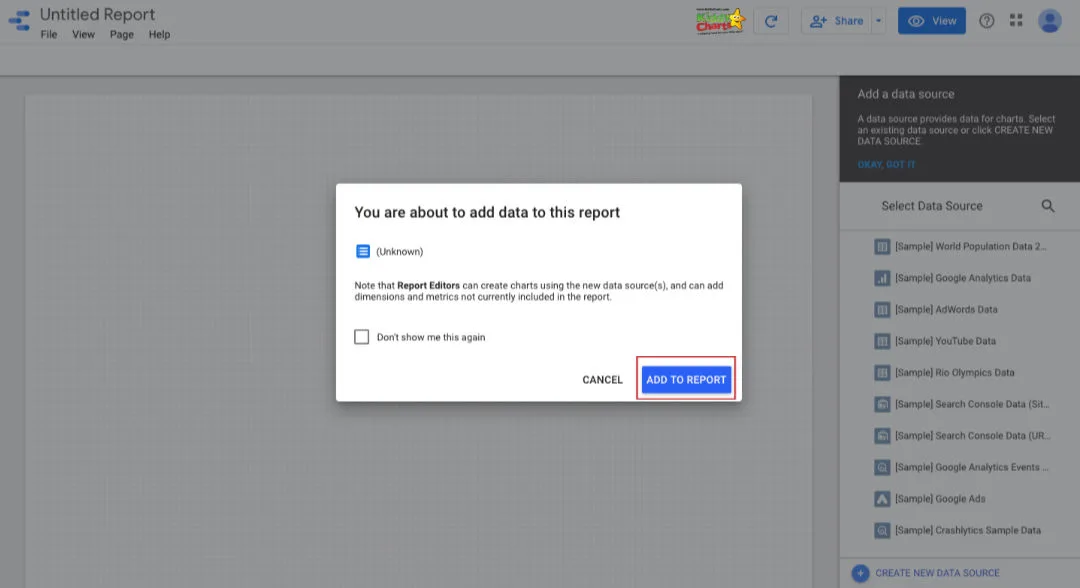
Wonderful – now you have connected your analytics account, so all you need to do is pull in your first data table to a report. Data Studio automatically starts to do this for you.
11) You need to select your: Account, Property, and finally the View that you want to use to collect your data. Most people will only have one each of these, so just double-click each one to move through to the final view column, double-clicking on that too.
12) When you double click on the view property, the Connect button top right should change to a blue clickable button, which you then need to click on to connect your website to Data Studio.

When you have done this – you can see a little bit of an intimidating screen, with all the fields that you can now access within Google Analytics in Data Studio. Don’t worry too much about this now though. We will explore that later.
13) For now, just change the title of the Data Source top left, and then click on Create Report top right and in a moment you will be creating your very first table within Data Studio…


And VOILA …
… you have a table of data for your website in your first ever Data Studio report. Granted its very basic, and the report doesn’t look that amazing. But everything is connected, and you are ready to WOW yourself with the things that you can get done!
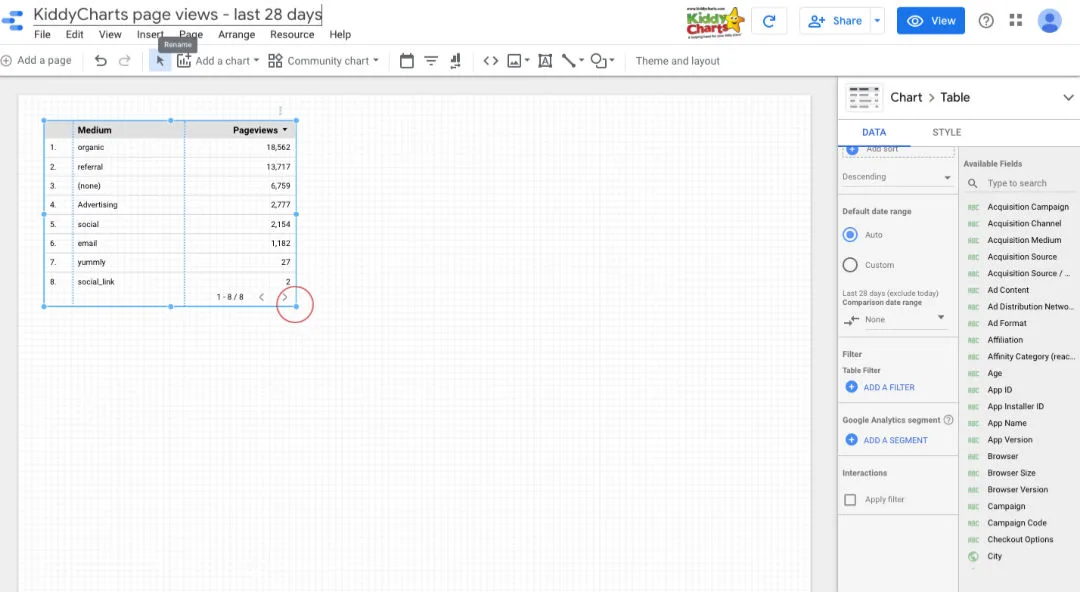
1) Change the title of the report (red box), and the data pulling through is automatically from the last 28 days within the green box.
Note: these are my annotations of course, no actual boxes on the screen 😂

If you look over on the right hand side you can see all the data you are displaying within the table (green box), the type of chart you are looking at (red box), and finally what available fields you have to display in your table or chart (yellow box).

2) If you want to surprise yourself with how amazing you are already; increase the size of the table by pulling the bottom right corner all the way across the screen….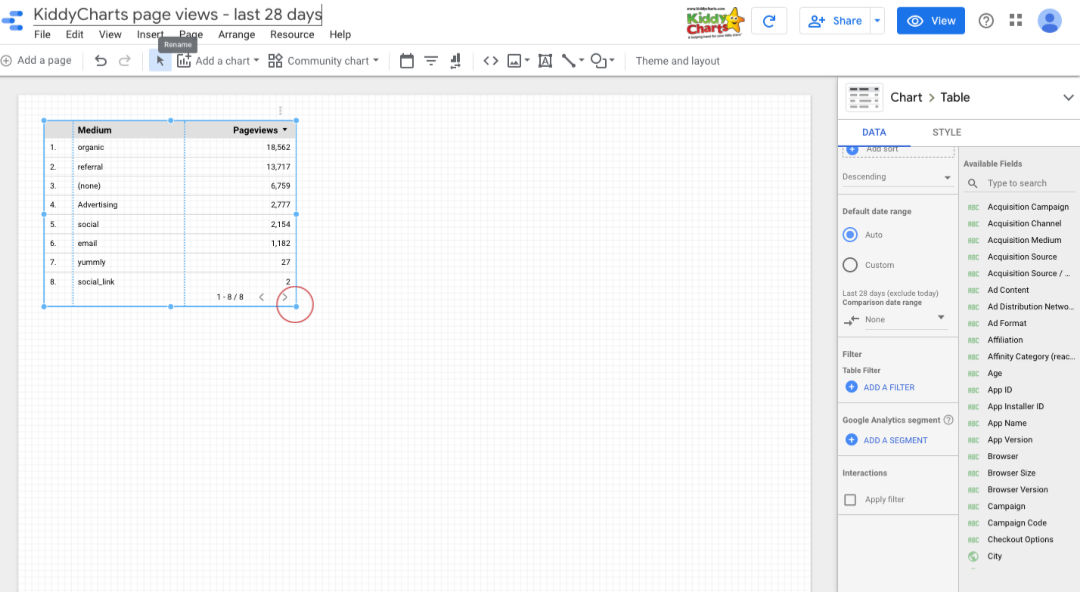


Now, not only do you have the total figures for your traffic sources from the last 28 days (which is the default), but you can see them all split down by day and colour coded. So you’ll know which is which. All done with two clicks!

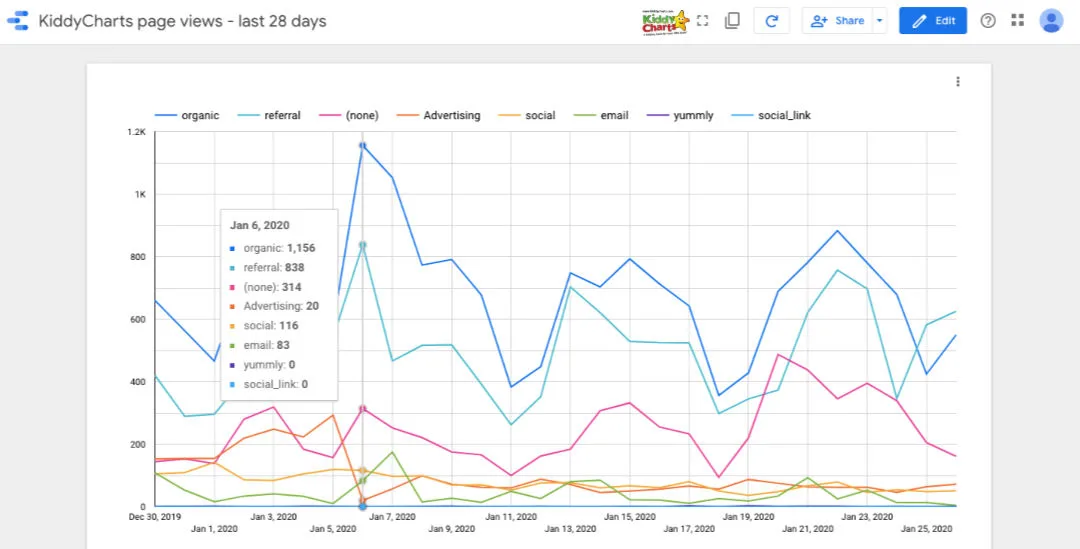
To come out of edit mode and see the report full screen – select View top right of your page. And here you go, a complete report of the traffic sources for your website.
You can, of course, go into much more details for these. But that’s a set of tips for another time. Make sure you come back soon, as you don’t miss them!
When you are in edit mode, you can however over any of the days in the last 28 to see the total traffic from each of the days. It’ll show you the total number of users from each source.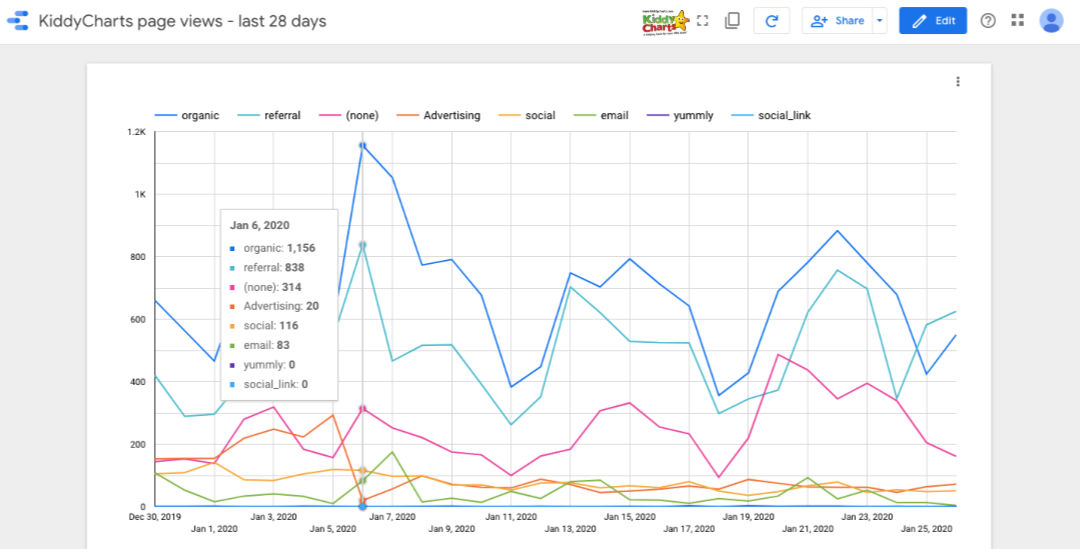
There you go – your FIRST Data Studio report. It only has one chart in, but you can probably already see how powerful the system is. Feeling brave enough? Pop over to Data Studio and copy a ready made template to take a closer look at your site.
How to copy a website template from the Data Studio gallery
1) Visit the Data Studio Gallery – we have chosen to list all the marketing related templates for you; but there are others.
2) Select the report template that you prefer – we have picked the one on the top row which focuses on website audience. This gives you a very quick view of what is happening on the site. There are others, and do have a play if you have time.


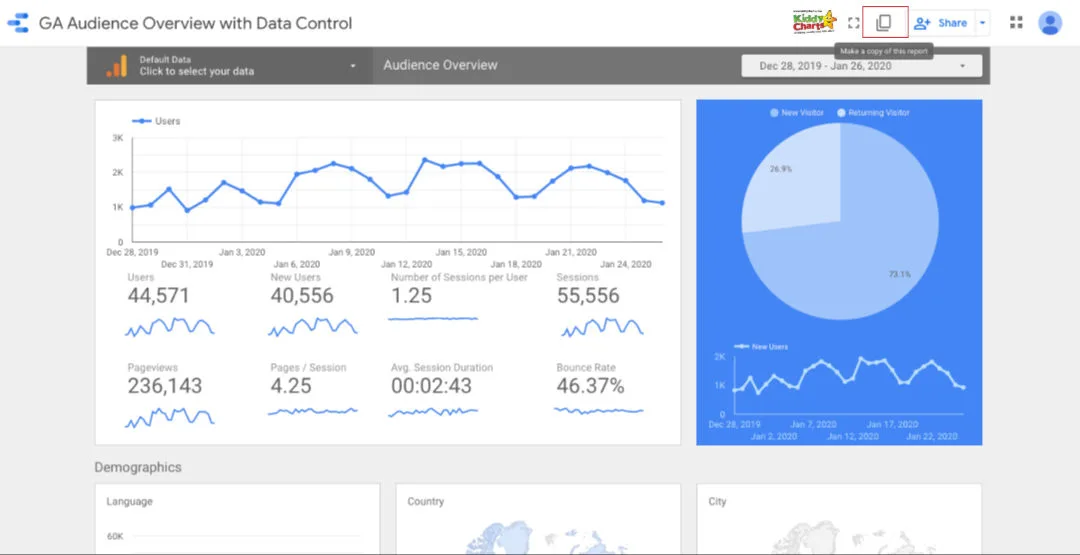
Data Studio will open the template in a new window, with data from a dummy site.
3) All you need to do is copy the report by clicking on the little copy icon top right on the screen of the template after it has opened (red box).
4) After selecting this, you will then need to add YOUR GOOGLE ANALYTICS account as a New Data Source in your copy of the report, (red box). It will replace all the stats with the information from your site.
5) Click the drop down arrow (in green circle) and then select the Copy Report blue button (yellow box).

Once this report is created, it is private to you and can only be seen on your Google Drive.
6) Click on the date within the red box, and then change using the calendar with the dates in the green box when this appears. We have changed the range to show Dec 2019.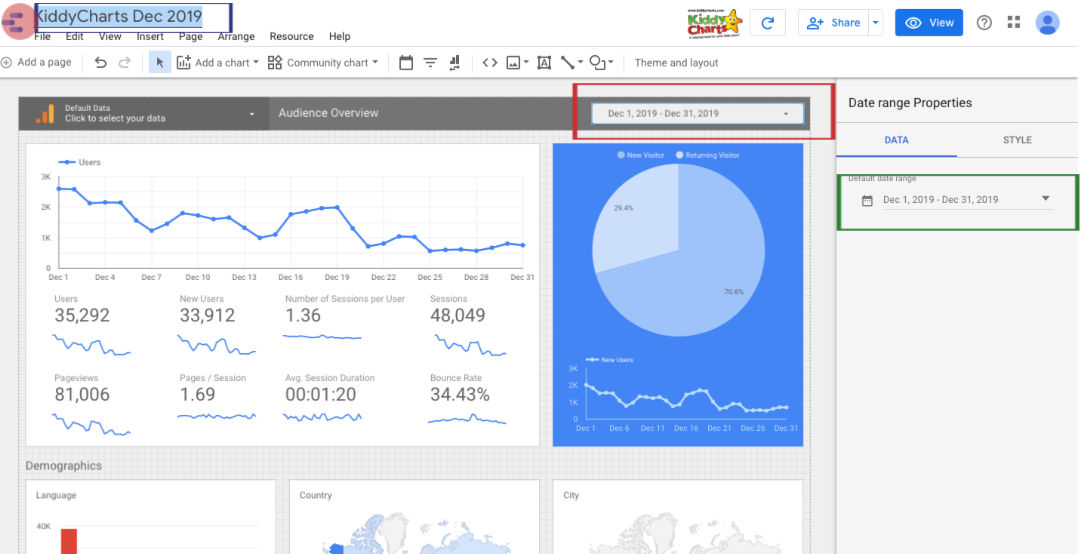

You can also change the name of the report (blue box top left) and leave the report by clicks on the little icon far top left to take you back to the Data Studio report list on your Google Drive.
Which, thanks for all your hard work going through this tutorial – you now have! So simple – you now have a very detailed report on your site, with just a few clicks!
Hope this Google Data Studio tutorial helped! We think this is UBER clever, and we hope you do too.
Stay up to date on the site and our articles. We cover blogging, printables, and parenting, and more. Sign up to our newsletter.
Blogging resources
If you are after more advice on influencing and blogging - do check out these posts too!


10 myths about influencers debunked
What is an influencer - we chat about it, and debunk some of the myths about them.
Adsense for bloggers: We've increased Adsense revenue by 300% in the last 6 months | AD
Adsense for bloggers - and using Ezoic for your blog.


Parent blogger resources and blogging tips
Some other resources you might like all collected together!
Thanks so much for coming to see us and pop over again soon.
Helen
Helen Neale
Helen is a mum to two, social media consultant, website editor and a qualified counsellor with experience of working with both children and adults.She is a registered member of the British Association of Counselling and Psychotherapists, with her own private practise. She also freelances with her local Mind organisation.Since giving up being a business analyst when juggling travel, work and kids proved too complicated, she founded KiddyCharts so she could be with her kids, use those grey cells at the same time, and supplement her counselling income.KiddyCharts has reach of over 680k across socials and the site. The site works with big family brands to help promote their services, as well as offering free resources to parents of kids under 10. She is a specialist counsellor for neurodivergent individuals and brings this expertise to her resources and the site. She is also an ADHDer herself.KiddyCharts gives 51%+ profits to charities, focused on supporting mental health and a community in TanzaniaHelen has also worked as a digital marketing consultant (IDM qualified) with various organisations, including Channel Mum, Truprint, Talk to Mums, and Micro Scooters. She loves to be creative in the brand campaigns she works on.Get in touch TODAY!